As most of you probably know there are literally hundreds of different ETFs available on the ASX but what you may not know is that the vast majority of them are being issued or managed by 1 of 5 major ETF providers. In 2019 over 90% of the ETFs invested in were being offered by the top 5 issuers, Vanguard, BetaShares, iShares, VanEck and Magellan. Whether that’s a good thing or not, well that’s not really up for me to decide, but that’s the reality and at least there is a decent amount of competition and offerings available.
2019 Australian industry listed ETF market cash flow by issuer (Top 5)
| Issuer | Cash Flow ($m) | Cash Flow (% of total market) |
| Vanguard | $5,108 | 37% |
| BetaShares | $2,870 | 21% |
| iShares | $2,574 | 19% |
| VanEck | $1,331 | 10% |
| Magellan | $551.4 | 4% |
Now if you clicked on this post, obviously you know that it will be focussed on VanEck, who definitely aren’t the largest ETF issuer in Australia but they are probably one of the most unique. And in this post I’m going to cover a few different VanEck ETFs that I think are worth watching out for and potentially investing in depending on your situation and investing strategy. We’ll look at what in my opinion is the best VanEck australian shares ETF, best global shares ETF, best emerging markets ETF, the best dividend ETF for income investors and what I consider the best overall VanEck ETF on the ASX.
I mentioned that VanEck is one of the most unique ETF issuers in Australia and this is because they specifically focus on providing ETFs to provide investors with opportunities to invest in often underrepresented sectors or asset classes, and they go about this in a way a bit differently to some of the larger ETF providers like Vanguard for example.
A large selection of the ETFs VanEck Australia provides are actually tracking indexes that have been designed with a “Smart Beta” strategy or thematic in nature. Which is a bit different to standard passive indexes that are just tracking the overall market like the ASX200 or S&P500. What this means for you is that these ETFs have the potential to actually outperform the market, or potentially underperform.
Investing has become more sophisticated in recent years. When actively managed funds were first offered to investors, performance was uncertain and the costs were high. Sometimes the returns were good, but often they weren’t. Many people found this a poor bargain and moved to lower cost passive funds which tracked traditional indices.
With these new passive index funds, returns could be thought of as average – not high, not low, just the market average. New innovations in index design for passive funds are delivering above market returns over the long term while retaining low costs. This is the new world of ‘Smart Beta’ and Thematic ETFs
ETF providers like VanEck are at the forefront of this new world by offering Smart Beta products that combine active and passive management styles. The result is portfolios based on intelligently designed indices that aim to outperform traditional benchmark indices, all while retaining the benefits of passive ETFs: low costs, transparency, liquidity and ease of trading.
Now without further ado let’s jump straight into the post and have a look at the first category which is the best VanEck Australian Shares ETF.
Best Australian Shares ETF – VanEck Vectors Australian Equal Weight ETF: MVW
This ETF is quite an interesting one compared to many Aussie shares based ETFs like VAS and A200, as while it does give investors exposure to a diversified portfolio of Australian companies, it does so in an equal weighting per holding, rather than a market capitalised based weighting. The ETF I’m talking about is the VanEck Vectors Australian Equal Weight ETF, ticker: MVW and the index it tracks is called the MVIS Australia Equal Weight Index, which is a rules-based index that combines benchmarking with blue-chip characteristics by tracking the performance of the largest and most liquid ASX-listed companies across all sectors, including offshore companies which generate at least 50% of their revenues or assets from the Australian market. Companies in the Index are weighted equally.
What this means is that the ETF always aims to have an equal percentage holding in each company inside the ETF, which is different to the market cap based approach from most other Australian Shares ETF. But as you’re probably wondering what does this really mean or why does this matter? Well historically it has meant that vs. ETFs like VAS and A200 that follow the more traditional ASX200 index, this equal weighting index has outperformed them every year.
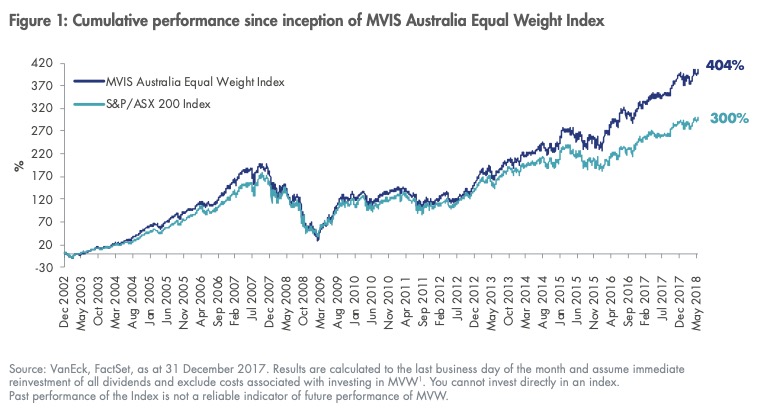
Looking at the historical returns we see that MVW has returned about 9% p.a over the last 5 years vs about 7.3% from the ASX200 in the same time period, a fairly significant difference over. In saying that, at 0.35% p.a triple the management fees of most low cost Australian shares ETFs like VAS and A200.
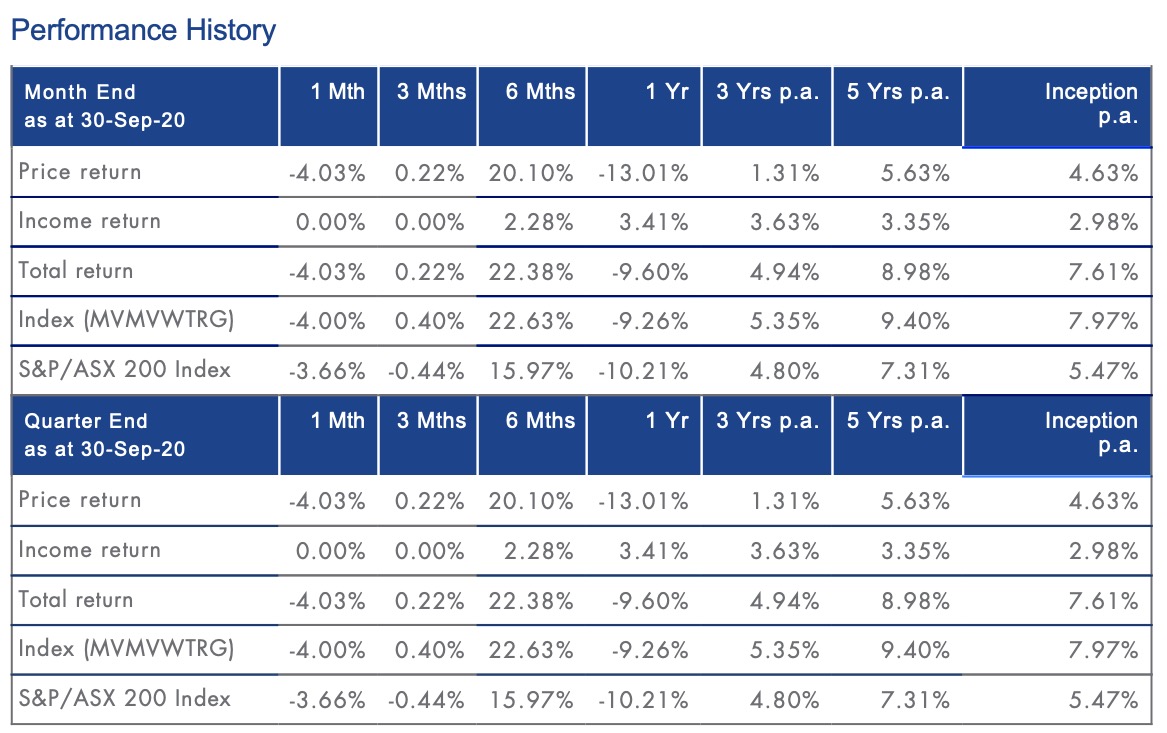
But we can see where it’s getting this difference in performance, as the holdings are very different compared to the ASX200. There are currently 97 holdings in MVW and the top 10 make up roughly 11% of the portfolio, whereas in VAS the top 10 holdings make up approximately 40% of the entire ETF.
MVW: Top ten holdings (%) as at 30-Sep-20
No. of holdings: 97
| Security name | ASX code | No. of securities held | Market value | % of Fund netassets | |
| NEXTDC LTD | NXT AU | 1,116,022 | 13,704,750 | 1.18 | |
| BORAL LTD | BLD AU | 2,991,710 | 13,642,198 | 1.17 | |
| WASHINGTON H SOUL PATTINSON & CO LTD | SOL AU | 579,132 | 13,615,393 | 1.17 | |
| SEEK LTD | SEK AU | 632,140 | 13,458,261 | 1.16 | |
| APPEN LTD | APX AU | 383,700 | 13,076,496 | 1.13 | |
| AFTERPAY LTD | APT AU | 163,220 | 13,055,968 | 1.12 | |
| ORORA LTD | ORA AU | 5,419,958 | 13,007,899 | 1.12 | |
| HARVEY NORMAN HOLDINGS LTD | HVN AU | 2,864,100 | 12,974,373 | 1.12 | |
| ALTIUM LTD | ALU AU | 359,181 | 12,901,782 | 1.11 | |
| SYDNEY AIRPORT | SYD AU | 2,201,548 | 12,901,071 | 1.11 | |
| Top ten total (%) | 11.39 |
MVW is a great ETF to consider for investors who want that core Aussie exposure but with a much greater diversification across companies and industries than a traditional market weighted ETF. And because of this it has that potential for outperformance of the ASX200, which it has done over the long term and almost every year in the short term as well.
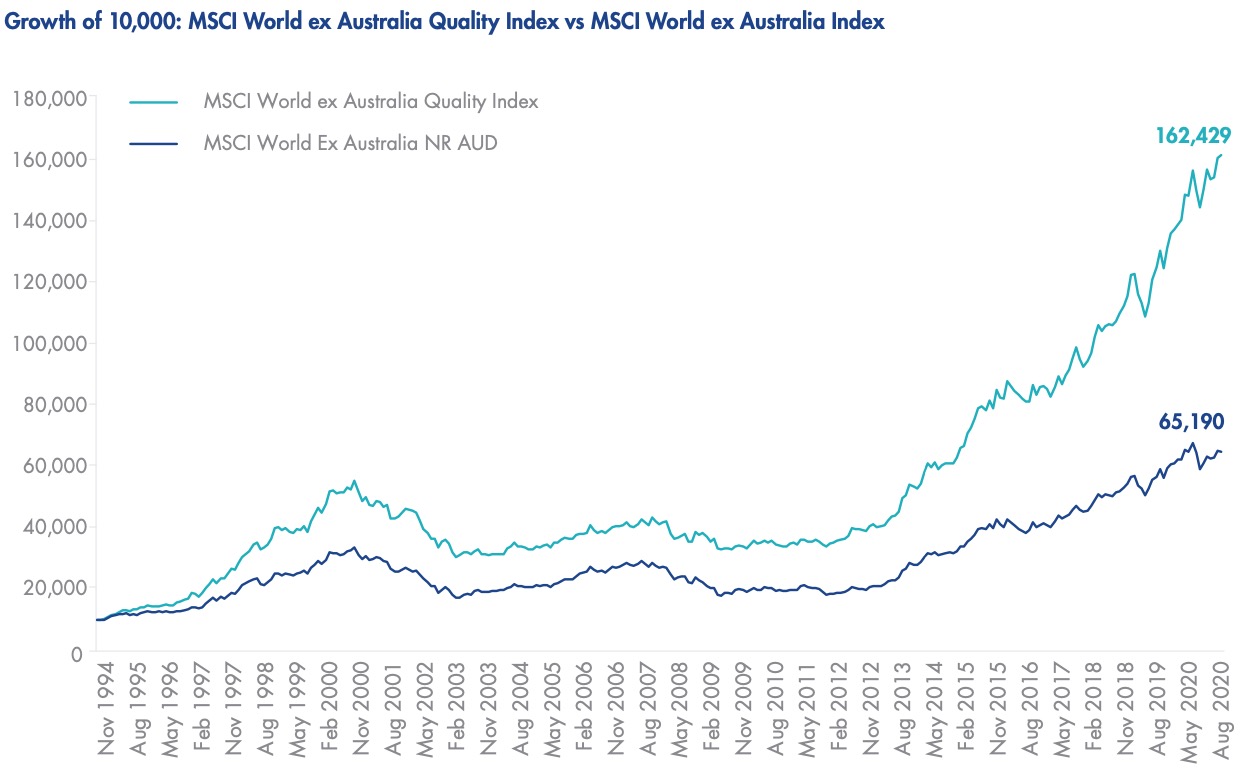
Best Global Shares ETF – VanEck Vectors MSCI World ex Australia Quality ETF: QUAL
Next we’re going to be moving onto a category that requires us to expand our outlook beyond just Australia and that’s the best VanEck ETF for Global Shares which at a time like this can be a pretty useful way to invest. Given that there is so much market volatility right now and it can be extremely hard to understand or comprehend which countries will perform better than others, that’s where having global exposure is something to really consider.
What I would consider the best VanEck ETF for international market exposure is the VanEck Vectors MSCI World ex Australia Quality ETF also known as QUAL.
There are a number of reasons why you should include international shares in your portfolio and specifically why QUAL is a good way to do this.
- Geographic diversification – the Australian stock market only represents around 3% of global stock markets;
- Better sector diversification – Australia is dominated by resources and financials with limited opportunities in technology and health care; and
- Exposure to different economic cycles.
QUAL is a diversified portfolio of high quality, international companies selected on the basis of three main attributes that go into it’s “quality” index.
- High return on equity;
- Stable year-on-year earnings growth; and
- Low financial leverage.
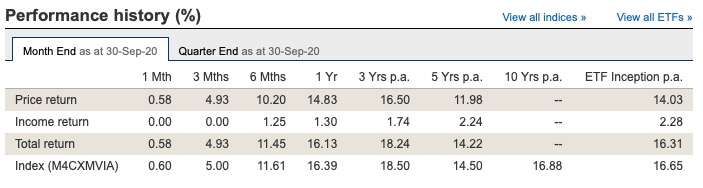
Through this quality index’s strategy QUAL has had significant returns compared to the standard world ex-australia ETF, which is the index that the VGS ETF by Vanguard tracks. Over the last 5 years QUAL has returned over 14% p.a, with most of it coming from capital return rather than income return. Management fees are fairly reasonable for an ETF of this type, at 0.40% p.a, and just an FYI all returns I am discussing are already net of any management fees.
QUAL is quite well diversified in terms of holdings with around 300 and provides global diversification, however it is quite concentrated within the US, with over 70% of the holdings coming from US companies. And you don’t get any currency hedging, which means you will be exposed to fluctuations in currency values between the AUD and countries that QUAL has share holdings in. There’s actually a version of QUAL that has hedging called QHAL which is otherwise identical to QUAL, however you need to pay a management fee of 0.43% p.a, a premium of 0.03% p.a for hedging.
Best Emerging Countries ETF – VanEck Vectors China New Economy ETF: CNEW
However if you’re not necessarily interested in global exposure and are looking to invest in emerging economies for higher potential growth, well I have you covered with the best VanEck ETF for emerging economies, that is the VanEck Vectors China New Economy ETF, or CNEW.
Traditionally economies like China have been dependent on financials, energy and materials. As GDP per capita has increased, domestic policy and reform has been focused on transitioning the economy to be consumption led.
There are four forces behind this transition in which consumer-oriented sectors
are gradually replacing heavy industry and low cost manufacturing as the country’s economic engines, they call this the “New Economy” and these are the sectors that the Chinese New Economy Index tracks.
CNEW seeks to provide investors with access to a portfolio of the most fundamentally sound companies with the best growth prospects in the consumer discretionary, consumer staples, healthcare, and technology sectors that are domiciled and listed in Mainland China with the aim of providing investment returns, before fees and other costs, which track the performance of the CSI MarketGrader China New Economy Index. This consists of the 120 most fundamentally sound companies in the consumer discretionary, consumer staples, healthcare and technology sectors, domiciled in Mainland China and traded publicly in the Shanghai and Shenzhen stock exchanges (A-Shares).
The Index seeks to identify the companies in China with the best growth at a reasonable price (GARP) attributes as the best drivers of long-term capital appreciation. The index constituents are selected on the basis of the strength of their fundamentals across four factor categories: growth, value, profitability and cash flow. The index is equally weighted at each of its semi-annual rebalances, giving each company an equal opportunity to contribute to the performance of the overall index.
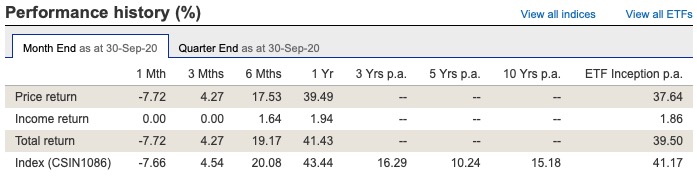
Now the returns of CNEW since inception have been pretty spectacular, it was launched at the end of 2018 and since then has returned almost 40% p.a. Now obviously that’s not a long enough time to accurately gauge the true performance of the ETF, we can however look at the index, that over the last 10 years has still returned over 15% p.a. Now this has come at quite a heavy cost, the management fee of CNEW being 0.95% p.a, which is probably one of the highest fees of any passive index ETF that I’ve seen. But this is quite indicative of the challenges and costs associated with trying to invest directly into Chinese companies via the Shanghai and Shenzhen stock exchanges, but because of these high fees, it really is one to only consider if you have strong conviction in the further growth of the Chinese economy vs. the rest of the world.
Personally I’m pretty bullish on the future outlook of the Chinese economy and I like that it provides a lot of sector diversification versus the many other traditional ETFs.
Best Dividend Income ETF – VanEck Vectors Morningstar Australian Moat Income ETF: DVDY
Now I haven’t forgotten all of you who love those sweet dividends, this next ETF is what I would consider the best VanEck ETF for dividend income, the VanEck Vectors Morningstar Australian Moat Income ETF, DVDY.
DVDY gives investors exposure to a diversified portfolio of dividend paying quality ASX-listed companies selected by Morningstar. DVDY aims to provide investment returns before fees and other costs which track the performance of the The Morningstar Australia Dividend Yield Focus Index™ which is intended to capture the performance of the 25 highest dividend paying ASX-listed securities (excluding A-REITs) that meet Morningstar’s required criteria which combines its Economic Moat™and Distance to Default measures.
This index basically combines the Morningstar Moat research, with companies that are least likely to default, as they have found this has historically been an effective predictor of dividend cuts. If you’re curious about this moat philosophy, moat investing provides a guideline for how to approach an investment portfolio. By applying a consistent, forward-looking process to identifying companies with sustainable competitive advantages, Morningstar turns the moat investing philosophy which many investors would apply in their own stock picking into an automatic investment strategy that can be applied via these passive index ETFs.
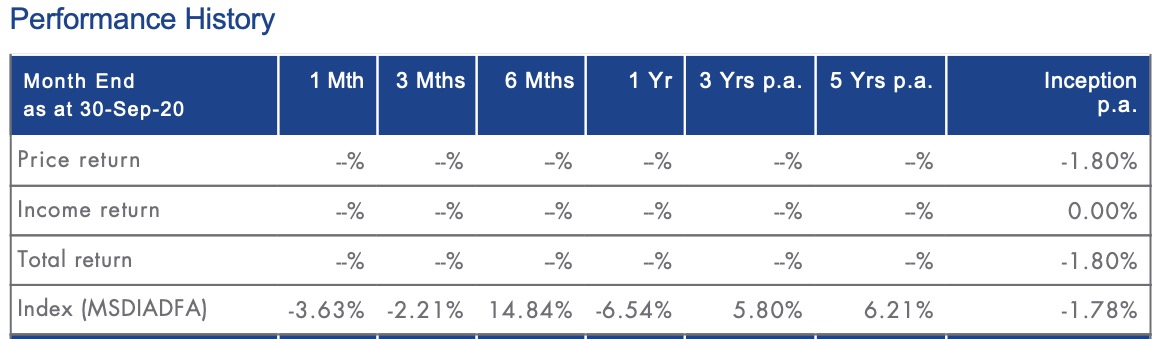
DVDY by VanEck is actually brand new, only launched to the ASX in September of 2020, so again not really any historically returns to go off, however over the last 5 years the index it tracks has returned over 6% p.a and pays dividends quarterly. DVDY has approximately 25 holdings at any time and a management fee of 0.35% p.a.
Some of you might actually recognise this index as it was actually used by a now closed ETF by UBS, listed on the ASX as DIV. This was closed and de-listed by UBS earlier this year in July, due to a lack of traction despite being around for over 6 years. So I would really only think about investing in this ETF if you are really a pure dividend investor and are looking for a passive way to invest in quality dividend paying companies in Australia. Personally I think there are better dividend ETFs out there on the ASX and I’ve talked about them in my Best Dividend ETFs on the ASX post but VanEck doesn’t really seem to focus on dividend ETFs in Australia, so this is the best they have at the moment.
Best Overall VanEck ETF – VanEck Vectors Morningstar Wide Moat ETF: MOAT
Intro, Historical returns, Fees, Top holdings/diversification, Summary
Now we’re finally here at the category for best overall VanEck ETF. This ETF has been around on the ASX since 2015 and on the NYSE since 2012, so it has quite a history as an ETF. The ETF I’m talking about in the VanEck Vectors Morningstar Wide Moat ETF, aka MOAT. MOAT gives investors exposure to a diversified portfolio of attractively priced US companies with sustainable competitive advantages according to Morningstar’s equity research team. MOAT tracks the performance of the Morningstar® Wide Moat Focus NR AUD Index.
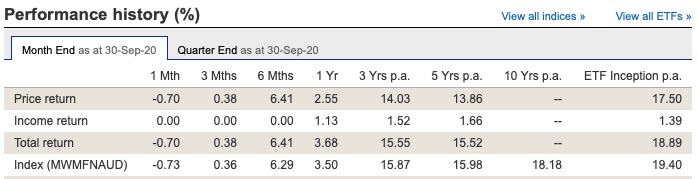
Over the last 5 years MOAT has returned over 15% p.a, over the last 10 years the index it tracks has returned over 18% p.a. With management fees of 0.49% p.a, it’s definitely not a cheap ETF but given the returns (net of fees), I certainly wouldn’t be complaining.
Obviously the index this ETF tracks uses something called a Moat investing strategy, which is something Morningstar is quite well known for. However they actually have a few different definitions of Moats.
Morningstar analysts assign an economic moat rating to each of the roughly 1,500 companies under our coverage. An economic moat is a sustainable competitive advantage that allows a company to generate positive economic profits for the benefits of its owners over an extended period. Of the companies we cover, 14% have a wide moat rating, 43% have a narrow moat rating, and 43% have a no-moat rating.
For a company to earn a narrow economic moat, excess normalized returns must, more likely than not, be positive 10 years from now. In addition, there must not be any substantial threat of major value destruction.
For a company to earn a wide economic moat, excess normalized returns must, with near certainty, be positive 10 years from now. In addition, excess normalized returns must, more likely than not, be positive 20 years from now.
Since this MOAT ETF uses the wide moat rating, all the holdings in the ETF (currently 48) should theoretically have positive returns with near certainty in 10 years. When you look at the holdings (which by the way are equally weighted with the ETF), you can see they are all stable, highly profitable companies that tend to have highly defensible positions against competitors.
Top ten holdings (%) as at 30-Sep-20
No. of holdings: 48
| Holding name | Ticker | % of Netassets(US$) | |
| SALESFORCE.COM INC | CRM US | 2.87 | |
| COMPASS MINERALS INTERNATIONAL INC | CMP US | 2.83 | |
| ASPEN TECHNOLOGY INC | AZPN US | 2.79 | |
| BERKSHIRE HATHAWAY INC | BRK/B US | 2.68 | |
| PFIZER INC | PFE US | 2.63 | |
| BRISTOL-MYERS SQUIBB CO | BMY US | 2.60 | |
| BIOGEN INC | BIIB US | 2.59 | |
| APPLIED MATERIALS INC | AMAT US | 2.58 | |
| MEDTRONIC PLC | MDT US | 2.57 | |
| CORTEVA INC | CTVA US | 2.56 | |
| Top ten total (%) | 26.70 |
The main downside of this ETF is that it only has exposure to US-based companies, however given the fact that over the long term it has a total return of almost 20% p.a, this is why I would still consider a very strong ETF choice and the best overall ETF that VanEck currently offers.
So there you go those are my top 5 VanEck Australia ETFs on the ASX in each of their categories. I’m sure these will be eventually changing over time but as of right now these are my thoughts. Let me know in the comments if you’re using any of the VanEck ETFs and what you’d like me to cover next!